
Sea level rise is likely to be one of the most serious and tangible consequences of future climate change. It is, as a consequence, a critical research challenge. Confidence in future projections will be dictated by our ability to correctly account for observed sea level changes from the recent past.
Variations in sea level are determined by three main components: (i) changes in the density of the oceans which is primarily influenced by temperature; (ii) changes in the mass of the oceans which is influenced by glaciers, ice sheets and land hydrology; and (iii) changes in the shape of the ocean floor and land surface due to long-term adjustments in the Earth’s crust. Significant uncertainties exist in each of these components and their sum falls significantly short of the observed sea level record from tide gauges most of over the twentieth century [1] – sometimes described as the “sea level enigma” [2].
Impacts of sea level rise
Future sea level rise is considered to be one of the most serious and tangible consequences of climate change. Coastal flood damages are expected to increase significantly during the twenty-first century as sea levels rise and socio-economic development increases the number of people and value of assets in the coastal floodplain [2].
The population worldwide exposed to a 1-in-100-year coastal flood is projected to increase from about 270 million in 2010 to 350 million in 2050 due to socioeconomic development alone [3]. For 136 coastal cities above 1 million inhabitants, the number of people exposed to a 1-in-100-year extreme sea level is expected to increase from 39 million in 2005 to 59 million by 2070 as a consequence of a 0.5 m increase in global mean sea level alone, and to 148 million if socioeconomic development is also considered [4].
A recent study estimated costs of up to €25 billion per year by 2080 for European countries alone from sea level rise [5], while for countries such as Bangladesh, Vietnam and small island states in the Western Pacific, the potential consequences are likely to be even more severe and profound.
The Intergovernmental Panel on Climate Change (IPCC) Fifth Assessment Report (AR5) [6] concludes that protecting against coastal flooding and erosion is considered economically rational for most developed coastlines in many countries under all socioeconomic and sea level rise scenarios.However, a crucial element of successful coastal adaptation decisions is a robust and reliable projection of sea level rise.
Understanding sea level
Sea level is undoubtedly one of the most fundamental variables for understanding how the planet is responding to climate change. Yet current methods for assessing the historical record offer conflicting and puzzling results, with the sum of the individual components of the sea level budget in some cases not matching the observed record of sea level rise.
Until very recently, the generally accepted estimate of twentieth century sea level rise was between 1.5 and 2.0 mm per year (e.g. [8]). However, the inability to account for this rate by summing the individual components for the period up to 1990 led to suggestions that the contribution from one or more components has been significantly underestimated [9].
A recent re-analysis of twentieth century sea level rise produced a lower average rate of sea level rise of around 1.2 mm/year between 1901 and 1990 [1], which does successfully close the sea level budget for this period. However, it provides no extra information about the contributions of individual sources and sinks, and perhaps most significantly, it implies that the observed rate of global mean sea level rise between 1993 and 2010 of around 3 mm/year represents a significantly larger acceleration than previously understood (nearer three times the twentieth century value rather than roughly double).
Understanding and constraining the causes of past sea level rise so that they are consistent with observations is key to improving our ability to predict future sea level rise. For example, the projections presented in the IPCC AR5 report [8] suggest thermal expansion of the oceans will make the largest single contribution to sea level rise to 2100. Yet recent observations show that ice sheets are currently making a larger contribution, and while this might not be a long term trend, it does suggest that our existing projections are not capturing all the physics, especially with regards to ice sheet melt.
Variations in sea level are determined by three main sets of processes (changes in the density of the oceans, changes in the mass of the oceans and changes in the shape of the ocean floor and land surface), the sum of which is referred to as the ‘sea level budget’. Determining the sources and sinks of, and ultimately ‘closing’, the sea level budget is essential for understanding the drivers of past variations of sea level and for improving predictions of future behaviour.
Traditionally, individual aspects of the sea level budget have been tackled separately within discrete disciplines – oceanography, solid-Earth geophysics, glaciology, hydrology – using different data, techniques and physical understanding. The consequence has been contradictory and inconsistent results that do not always provide a good match with the observed sea level record and ‘actual’ sea level change.
Observations and data
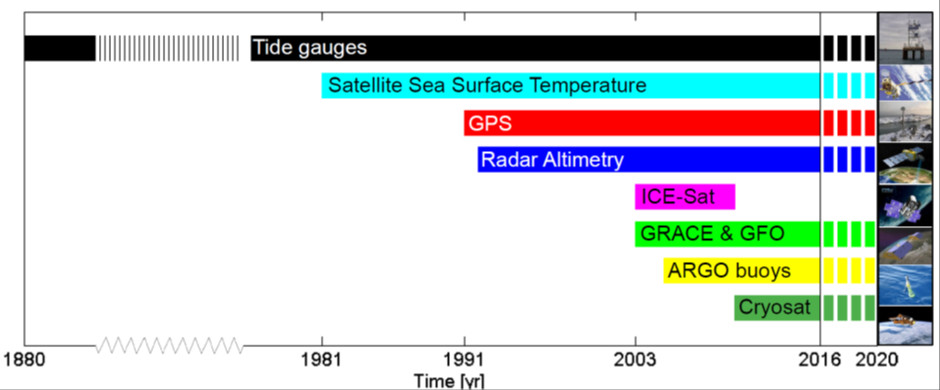
Since around 2000, there has been a revolution in our ability to observe and record almost all components of the sea level budget via new satellite and in-situ approaches. For example:
• The Gravity Recovery and Climate Experiment (GRACE), launched in 2002, has allowed us, for the first time, to measure the exchange of mass between the land and ocean at a global scale [10].
• The network of Argo buoys, dating from about 2004 and now exceeding 3,000 sites, is providing unprecedented information about changes in ocean heat content [11] [12].
• Satellite radar altimetry, since 1993, has provided monthly, high accuracy, estimates of absolute sea level between ±65° latitude.
• GRACE and the ICESat satellite laser altimeter mission, in operation between 2002 and 2009, provide comprehensive estimates of ice mass loss for glaciers and ice sheets worldwide [13] [14].
These new observational capabilities supplement and complement older, longer and more “traditional” time series from, for example, the long-term tide gauge network [15], shipborne ocean temperature data, geodetic and glaciological field measurements of individual glacier mass balance [16] and the global network of GPS stations measuring vertical land motion [17].
The different observational approaches and associated datasets are, however, generally not consistent with each other or with the average long-term sea level signal. Few scientists have been in a position to tackle the complete sea level budget problem because of (i) the volume and complexity of the observations, (ii) the multidisciplinary nature of the challenge and (iii) the extremely demanding nature of the statistical techniques and computational resources needed for a problem of this scale.
References
[1] Hay, C. C., E. Morrow, R. E. Kopp and J. X. Mitrovica (2015). “Probabilistic reanalysis of twentieth-century sea-level rise.” Nature.
[2] Munk, W. (2002). “Twentieth century sea level: An enigma.” Proceedings of the National Academy of Sciences 99(10): 6550-6555.
[3] Hinkel, J., et al., Coastal flood damage and adaptation costs under 21st century sea-level rise. Proceedings of the National Academy of Sciences of the United States of America, 2014. 111(9): p. 3292-3297.
[4] Jongman, B., P.J.Ward, and J.C.J.H.Aerts, 2012: Global exposure to river and coastal flooding: long term trends and changes. Global Environmental Change: Human and Policy Dimensions, 22(4), 823-835.
[5] Hanson, S., R. Nicholls, N. Ranger, S. Hallegatte, J. Dorfee-Morlot, C. Herweijer, and J. Chateau, 2011: A global ranking of port cities with high exposure to climate extremes. Climatic Change, 104(1), 89-111.
[6] Brown, S., et al., The impacts and economic costs of sea-level rise in Europe and the costs and benefits of adaptation. Summary of results from the EC RTD ClimateCost Project, in 1. The ClimateCost Project. Final Report. Volume 1: Europe, P.e. Watkiss, Editor. 2011. p. 44.
[7] Wong, P.P., I.J. Losada, J.-P. Gattuso, J. Hinkel, A. Khattabi, K.L. McInnes, Y. Saito, and A. Sallenger, 2014: Coastal systems and low-lying areas. In: Climate Change 2014: Impacts,Adaptation, and Vulnerability. Part A: Global and Sectoral Aspects. Contribution of Working Group II to the Fifth Assessment Report of the Intergovernmental Panel on Climate Change [Field, C.B., V.R. Barros, D.J. Dokken, K.J. Mach, M.D. Mastrandrea, T.E. Bilir, M. Chatterjee, K.L. Ebi, Y.O. Estrada, R.C. Genova, B. Girma, E.S. Kissel, A.N. Levy, S. MacCracken, P.R. Mastrandrea, and L.L.White (eds.)]. Cambridge University Press, Cambridge, United Kingdom and New York, NY, USA, pp. 361-409.
[8] Church, J. A. et al. in Climate Change 2013: The Physical Science Basis. Contribution of Working Group I to the Fifth Assessment Report of the Intergovernmental Panel on Climate Change (eds Stocker, T. F. et al.) Ch. 13 (Cambridge Univ. Press, 2013).
[9] Gregory, J. M. et al. Twentieth-century global mean sea level rise: is the whole greater than the sum of the parts? J. Clim. 26, 4476–4499 (2013).
[10] Riva, R. E. M., J. L. Bamber, D. A. Lavallée, and B. Wouters (2010), Sea-level fingerprint of continental water and ice mass change from GRACE, Geophys. Res. Lett., 37, L19605, doi:10.1029/2010GL044770.
[11] Leuliette, E. W., and L. Miller (2009), Closing the sea level rise budget with altimetry, Argo, and GRACE, Geophys. Res. Lett., 36, L04608, doi:10.1029/2008GL036010.
[12] Willis, J. K., D. P. Chambers, and R. S. Nerem (2008), Assessing the globally averaged sea level budget on seasonal to interannual timescales, J. Geophys. Res., 113, C06015, doi:10.1029/2007JC004517.
[13] Jacob, T., J. Wahr, W. T. Pfeffer and S. Swenson (2012). “Recent contributions of glaciers and ice caps to sea level rise.” Nature 482(7386): 514-518.
[14] Kaab, A., E. Berthier, C. Nuth, J. Gardelle and Y. Arnaud (2012). “Contrasting patterns of early twenty-first-century glacier mass change in the Himalayas.” Nature 488(7412): 495-498.
[15] Holgate, S. J., A. Matthews, P. L. Woodworth, L. J. Rickards, M. E. Tamisiea, E. Bradshaw, P. R. Foden, K. M. Gordon, S. Jevrejeva and J. Pugh (2013). “New Data Systems and Products at the Permanent Service for Mean Sea Level.” J. Coastal Res. 29(3): 493-504.
[16] Zemp, M., M. Hoelzle and W. Haeberli (2009). “Six decades of glacier mass-balance observations: a review of the worldwide monitoring network.” Annals of Glaciology 50(50): 101-111.